C code. C code run. Run code run...please!
-- Barbara Ling
Introduction
C++ is hard people say. Program in some other language. Like Java or C#. When asked, people who champion these languages usually agree that the garbage collecting is godsent and that memory management is a mess in C++. While I'm not disagreeing that sweeping the memory problem under the rug is kind of nice (hey, I do a lot of python programming) I don't understand why memory management should inherently be difficult in C++. There are ways to shoot yourself in the foot, several times with a bazooka. But there are also relief. There are some simple rules that you can follow to minimize your allocation hell. We will discuss some of them here, as well what to do when everything falls down on your head and you wind up with a memory leak. It's a little bit of a jumble, a little bit of an safari as the title suggests :)
Caveats, tools
This article is going to be very much win32 centric and even Microsoft compiler centric. Sorry for all you unix guys out there, but there are corresponding tools for your platform as well. If you have a win32 box but no compiler, there is still hope since Microsoft provides their express edition of visual studio for free. You will get all the optimizations of the command line compiler. The IDE is a little bit crippled and the CRT source code is not shipped either. But other than that, it's fully functional. The only annoyance is that the plugin feature is disabled, doh.
Best practices
Here are some best practices for keeping the memory management simple. They're not all of them by far, but something to get you started.
Using object semantics
There are several places when instead of holding pointers you can hold objects themselves. Holding pointers offers several attractive features, like the ability to forward declare types in headers to decrease compile times, explicit control of object lifetime etc. But the bulk of your objects are probably going to be owned by another object. That parent object can in most cases hold you by value, and presto -- no new/delete. Of course, the top object is probably going to be allocated on the heap to avoid having ridiculous stack space requirements, but that's the minority of object management.
Implement deep copy or revoke it
If you ever have an object with a pointer in it to a resource allocated by the object itself, you should consider to either revoke the copy constructor and assignment operator or implement them to do a deep copy. For objects where a copy doesn't really make sense, I usually chose just to revoke the copy and assignment.
class Foobar
{
private:
    Foobar( const Foobar& );
    Foobar& operator=(const Foobar& );
public:
    Foobar() : m_data( new char[32] ) {}
    ~Foobar() { delete[] m_data; }
private:
    unsigned char* m_data;
};
Sometimes it makes sense to be able to copy the object though. Consider the normal string class example. It could be implemented in several ways, but it's quite clear that when I copy one string into another I expect their contents to be unique so that I can modify one without affecting the other. I can accomplish this in several ways, maybe deep copy or a copy on write scheme. Listing (2) shows a simple class that have an internal buffer that it needs for some reason to allocate from the heap.
class Foobar
{
public:
    explicit Foobar( unsigned int size )
        : m_size(size)
        , m_data( new char[size] )
    {
    }

    Foobar( const Foobar& r)
        : m_data(0)
    {
        *this = r;
    }

    Foobar& operator=(const Foobar& r)
    {
        delete[] m_data;
        m_size = r.m_size;
        m_data = new char[m_size];
        memcpy(m_data, r.m_data, m_size);
        return *this;
    }

    ~Foobar()
    {
        delete[] m_data;
    }

private:
    unsigned int m_size;
    unsigned char* m_data;

};
Start using std::vector
So you need a temporary variable inside a function and you are considering the sin to allocate memory from the heap? In that case consider using std::vector to allocate the temporary buffer. No need to remember to delete the buffer. Downside is of course that you increase compile times by including STL. Well, the code below is probably only going to wind up in tools code anyways and not in the game engine (hopefully, although I've seen that too).
void doStuff( int count )
{
   std::vector< unsigned char > buffer(count);
   expensiveFillMemory( &buffer[0], count );
   operateOnBuffer( &buffer[0], count );
}
If we would have used std::vector as the type for m_data in the previous Foobar class, we would have gotten the deep copy for free, since std::vector itself implements object semantics.
Defer allocation strategy with custom allocators
Using STL gives you a head start in implementing your objects and algorithms as a lot of the basic stock code is already provided for you. Usually in really critical pieces of code you wind up with such a simple strategy of allocating memory in the end that it's easier to just allocate the memory yourself and not use STL. But the road to this point might not be so easy and the development speed can gain huge boosts by using STL as an intermediate solution. That intermediate solution can also be promoted to the final solution as long as you take care. One of the tings you can do to improve efficiency and speed is to provide custom allocators for the containers you're using. Implementing a custom allocator for STL is not trivial, Scott Meyers have a good chapter on this in his Effective STL book which if you're programming STL at all you should already have on your desk. Seriously. Read it. Have the company buy a copy or two for their library.
An article on codeguru describes the custom allocators a little for those who can't wait for the book to arrive in the mail. Here at home I have a template shown below in listing(4) that binds an allocator to a container as well. Feel free to use this as a start for writing your own. The template requires another class/struct with two static members, malloc and free. The malloc function takes a couple of extra parameters for debugging purposes, but it's easy to change. Now with this little handy class you can plug in any little allocator for your container. Block allocators come to mind, especially the block allocator that Andrei Alexandrescu describes in his book Modern C++ Design. With a custom allocator you can actually get away with using STL for a surprising amount of code.
template < typename T, class Provider >
class CustomStlAllocator
{
public:
    typedef size_t    size_type;
    typedef ptrdiff_t difference_type;
    typedef T*        pointer;
    typedef const T*  const_pointer;
    typedef T&        reference;
    typedef const T&  const_reference;
    typedef T         value_type;

    CustomStlAllocator() throw() {}
    CustomStlAllocator(const CustomStlAllocator&) throw () {}

    template <class U>
    CustomStlAllocator(const CustomStlAllocator<U,Provider>&){}

    ~CustomStlAllocator(){}

    template <class U>
    CustomStlAllocator& operator=(const CustomStlAllocator<U,Provider>&) throw()
    { return *this; }

    pointer address(reference x) const { return &x; }
    const_pointer address(const_reference x) const { return &x; }
    CustomStlAllocator& operator=(const CustomStlAllocator&) { return *this; }
    void construct(pointer p, const T& val) { new ((T*) p) T(val); }
    void destroy(pointer p) { p->~T(); }

    size_type max_size() const { return size_t(-1); }

    template <class U>
    struct rebind { typedef CustomStlAllocator<U,Provider> other; };

    pointer allocate(size_type n, const void * = 0)
    {
        return (pointer)Provider::malloc( int(n * sizeof(T)) );
    }

    void deallocate(void* p, size_type)
    {
        Provider::free( p );
    }
};
Start using unit tests
One of the main things with TDD is that you should start to take small steps in development. Incremental steps with continious checks for errors should take the bugs out of your code. So what if we can have checks for memory leaks as part of our tests? Well it turns out that we can really easily on win32 with a little help of the dbgheap.
If you have not found it yet, you should check out UnitTest++, a nice lightweight framework for unit testing. One of the things that UnitTest++ allows us to do is to take over the main loop. Since all it takes is to return a non zero value for the unit test to fail (since we rely on the standard return code checks) we can write out own main function that checks memory leaks and flags them as errors:
#ifdef _MSC_VER
   #include <crtdbg.h>
   #include <cstdio>

   static int g_linesReported = 0;
   int myReportFunction( int , char* message, int* )
   {
      g_linesReported++;
      std::printf( "%s\n", message );
      return 1;
   }
#endif

int main(int, char const *[])
{
    int returnCode = UnitTest::RunAllTests();

#ifdef _MSC_VER
   _CrtSetReportHook(myReportFunction);
   _CrtDumpMemoryLeaks();
   if( g_linesReported > 0 )
      returnCode++;
#endif

    return returnCode;
}
Performing Post-Build Event...
Success: 109 tests passed.
Test time: 0.19 seconds.
Detected memory leaks!
Dumping objects ->
{101}
normal block at 0x00355C08, 10 bytes long.
 Data: <          > CD CD CD CD CD CD CD CD CD CD
Object dump complete.
Project : error PRJ0019: A tool returned an error code from "Performing
Post-Build Event..."
Build Time 0:01
TestUnitTest++.vsnet2005 - 1 error(s), 1 warning(s)
Of course this is very much bare bones. But you get the idea here, call _CrtDumpMemoryLeaks after you've set the callback hook to your own report function and then count how many times this function is called. It's a little bit tricky to determine how many times this function is called, at the framework I've got there is some heuristics to determine if a memory leak has been found, but that code is a little too large to show. You can also place this around the actual test in order to find out which test is leaking.
The observant reader might already have deduced that this really doesn't work with static constructors that allocates memory since it all relies on us being able to run the check memory leaks call as part of the normal execution, as opposed to the static constructors/destructors. If you have static constructors allocating memory you need to flag them as non checked before you run this sort of leak checking.
The debug CRT heap
The win32 standard c runtime library contains a couple of functions that in debug mode can help a lot with tracking down memory leaks. These can be integrated into your application with minimal effort. The main problem is that it's very platform dependant. The crtdbg library have several nice features, amongst them:
- Tracking of filename and line number
- Leak detection
- Break on allocation
- Integrity checking (memory walls)
The best thing about all this is that you get it for free, you don't have to write anything yourself. The filename and line number tracking is not perfect though, if you for example have a leak in some third party library or STL that doesn't respect the operator new overloading that the crtlibrary provides for tracking, you will just get a report with a leak when you call _CrtDumpMemoryLeaks. There is however relief. _CrtDumpMemoryLeaks will in addition to the file/line also report an allocation number, so if you have a deterministic allocation scheme you can rerun the application and have the runtime assert on that allocation. Tracing the callstack in the debugger should now be a breeze. How do you set which allocation to break upon? With the little function _CrtSetBreakAlloc.
Another thing that is important to realize is how new/delete is implemented on the crt. First the request goes to new, which in turn calls malloc, which in turn calls HeapAlloc. All of these functions add a little bit of overhead and also implement different protocols for debugging. New/delete actually is overloaded in debug versions to record the filename and the linenumber. Malloc in turn fills the memory with a well known pattern in debug mode. These two things are controlled by the application and are set when the application is compiled. The HeapAlloc function and it's functionality is built into the os on the other hand and can be changed on the fly outside the application. HeapAlloc also fills the memory with patterns as well as provides memory walls. More on this later.
Exploring debugging with the debug CRT
Memory leaks are not the only bane of the memory fun. One of the common beginner mistakes are to do the dreaded double delete of a pointer. This is however pretty easy to find with the help of the debug library at the point of the deletion since it will fire up a helpful assert dialog.
Usually things goes very wrong long before the point of deletion and then it can be helpful to know that the crt is still helping you to find spots where you're misusing your memory. The allocation and the deallocation routines in debug mode will actually fill the memory with well known pattern for uninitialized allocated memory, free memory and memory walls:
- New memory: 0xCD (as in Clear Debug memory)
- Free memory: 0xDD (as in Dead Debug memory)
- Memory wall: 0xFD (as in Fence Debug memory)
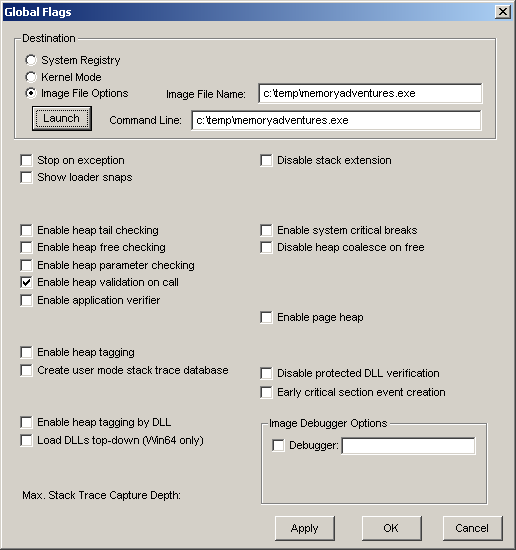
That is all well and good, but in release we've not linked with this nifty little debug library. Breaking into release mode code can be daunting enough, reading assembler requires a little bit of work. You can always turn off optimizations for the current file you think the crash is in though (or through #pragma optimize) and then step into the code in the debugger. Usually you find yourself with a pointer and wondering if it's wild or not. A very quick way to make sure that it isn't is to enable the heap validation routines built into the OS and check the memory patterns at that memory location. If enabled the OS routines will actually fill new memory with 0xBAADF00D and deleted memory blocks will be filled with first two pointers to next and previous memory block and then 0xFEEEFEEE. Since the actual memory block always is larger than 8 bytes, we can just look at the dword at offset 8 to find out if it's a old block.
You will need the little tool gflags which is part of the Support Tools for Advanced Users to enable heap validation. After you've gotten this little program you can now set the global debug flags for your machine. An interesting flag is "Enable heap validation on call", which seems to enable both a memory pattern fill and a memory wall. You can also take a look at the memory adventures program here.
More adventures
On unix platforms there are much easier ways to track allocations, mainly provided by the OS vendors as specialized tools. Some of them rely on the LD_PRELOAD feature of most unices, which is great. Windows users often look a little bit with envy on this, but there is hope! Andy put together this little tool that provides the same functionality. The possibilities here are endless, we could easily do non intrusive instrumentation and capture all the allocations and deallocations by a application (as long as we have the debug symbols) and write them down to a file for later analysis. This way we can even track leaks in the static constructors and destructors! This kind of relies on the fact that we use well known functions and don't do any voodoo magic when we allocate things as well as linking with the dynamic link library version of the CRT.
In closing
I hope this gave some insight in how you can take advantage of the tools that Microsoft windows provides with tracking down memory problems, as well as given some pointers on how to avoid falling into that trap in the first place. I've gotten into the habit a long time ago to always enable the memory leak detection and every now and then run the application to verify that there were no leaks. Ever since I've started to do proper TDD I get a little bit worried that the memory leak detection doesn't work since it doesn't seem to fail, so I write an intentional leak and try it out. Sure enough the framework reports a leak and fails my compilation. Phew. But in light of that, it's certainly possible to write software in C++ without leaks. If you're using TDD it's even easier once you've added memory leak detection as a failure condition. I actually had my framework at one time also check for handle leaks, which was very handy once you developed native win32 code, since sometimes it's tricky to know when to free those handles. It could be a possible extension to UnitTest++ or your own unit test framework.